
Database overview#
The BoSS holds 179,049 stellarator equilibria gathered from many sources. Every device goes through the same pipeline: an ideal MHD equilibrium is computed, followed by fast-ion confinement simulations of alpha particles.
179,049 configurations
2.7 billion alpha particles traced
134 million full particle orbits
3.2 TB of HDF5 files
Sources#
The field source_dataset records where each configuration came from. The
configurations come from about 97,000 distinct source devices
(source_id). A boundary can appear more than once, with different
pressure and current profiles, and scaled to a different machine size and
field strength.
Source ( |
Description |
Configurations |
|---|---|---|
|
Quasi-axisymmetric and quasi-helically symmetric stellarators from QUASR (Giuliani et al.). |
70,764 |
|
Quasi-isodynamic-like boundaries from the ConStellaration dataset (Cadena et al., 2025). |
66,135 |
|
Boundaries generated randomly using active learning. Generated for the BoSS paper. |
13,922 |
|
Unoptimized rotating ellipses with random elongation, aspect ratio and axis torsion. Generated for the BoSS. |
7,932 |
|
Boundaries chosen with active learning using surrogate optimization. |
7,635 |
|
Rotating ellipses with random perturbations in their higher Fourier modes. Generated for the BoSS. |
6,872 |
|
Boundaries optimized for alpha-particle confinement using a surrogate model. Generated for the BoSS. |
5,530 |
|
Omnigenous equilibria computed with DESC, from the omnigenity database of Gaur et al. (2023). |
185 |
|
Stellarator and tokamak configurations collected by Kappel et al. (2024). |
64 |
Others |
|
10 |
Distributions#
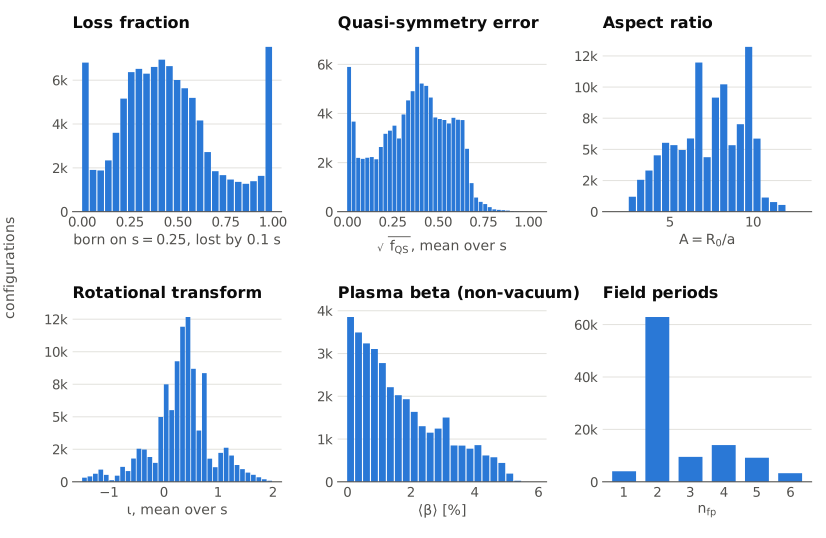
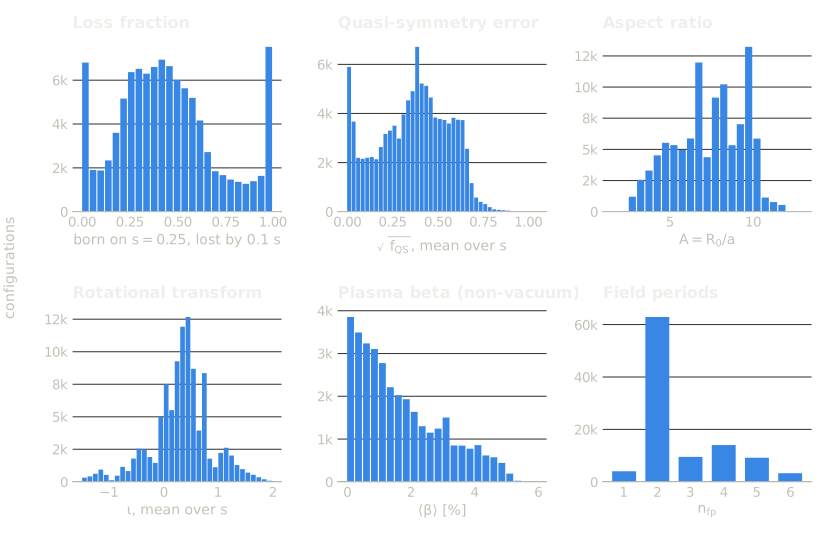
The top row shows the loss fraction of the particles born on \(s = 0.25\), the quasi-symmetry error (the square root of the summed squares of the Boozer \(\lvert B \rvert\) harmonics that break quasi-symmetry, relative to the symmetric ones, averaged over the flux surfaces) and the aspect ratio. The bottom row shows the mean rotational transform, the plasma \(\beta\) of the non-vacuum devices, and the number of field periods.
Many devices deviate strongly from quasi-symmetry, although a large share come from QUASR, a database of devices optimized for quasi-symmetry. About a third of the devices have finite pressure, with \(\langle\beta\rangle\) up to about 6%; most of them are above the reactor-grade value of 1%.
Files#
The data comes in two kinds of HDF5 files: confinement files and trajectory files. They differ only in the type of guiding-center information they carry. Confinement files have particle initial and final states, whereas trajectory files contain full trajectories.
Confinement files |
Trajectory files |
|
|---|---|---|
Fast-ion data |
Start and end state of all 15,000 particles |
Full orbits of 6,000 particles |
Configurations per file |
up to 3,000 |
up to 40 |
Train split |
52 files, 279 GB, 154,128 configurations |
479 files, 2.46 TB, 19,123 configurations |
Test split |
9 files, 45 GB, 24,921 configurations |
80 files, 411 GB, 3,184 configurations |
The confinement files (325 GB in all) are enough to compute loss fractions and heat fluxes. The trajectory files (2.9 TB) hold 134 million orbits for 22,307 of the configurations. See Download Data to download the data.
Train/test split#
The file names indicate the split they belong to, train or test. The test split holds 24,921 configurations (14%), drawn at random across sources. All configurations that come from the same source device are in the same split, so a model is never tested on a rescaled copy of a device it was trained on.